VARIABLES
The most important things to know when you design
your experiment is what are your controls and variables. There are different
types of variables. Listed below are explanations and examples.
MANIPULATED VARIABLES:
These are variables that you change on purpose in your experiment. It
is what you are testing.
RESPONDING VARIABLES:
These are the changes that happen in your experiment because of what
you changed
.
CONSTANT VARIABLES:
These are the variables that are held constant or are assumed to stay
the same
during the experiment.
EXAMPLES
In a science project that would investigate "What is the effect
of changing soil pH on plant growth," here are some examples of the
different types of variables.
MANIPULATED VARIABLES:
pH. Probably the water that is used to nourish the plants will have chemicals
added to it. A wide range of pH is good to use.
RESPONDING VARIABLE:
Plant growth. You might determine plant growth by measuring the height
of the plant, thickness of the stem, and/or the number of leaves before
and during the experiment.
CONSTANT VARIABLES:
Temperature, Light, Type of Plant, and Type of Soil would all be variables
that you should keep the same for all the plants for the whole time of the
experiment. If possible, you should also record values for these variables-
what is the temperature, what is the amount of light, and for how long,
etc... .
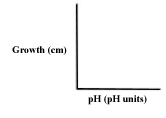
GRAPHING RESULTS
In displaying your results in a graph, the manipulated variable always
goes across the bottom on the x-axis and the responding variable always
goes up the y-axis. The values of the constant variables are not actually
graphed but can be stated in the legend for the graph. This type of graph
is always a line graph. Remember that a line graph shows change.
A bar graph shows a comparison between things. If the project above
used different types of plants and soils, bar graphs could also be done
to compare one type of plant to another or one type of soil to another.
EXAMPLES:
Data Chart
Line Graph